Getting started with Clarios
Clarios shows you, simply and at a glance, how secure your Microsoft 365 environment is: your devices, your people’s sign-ins, a security check, and protection for your email. This page gets you to your first dashboard in a few minutes.
ℹ️ Note: The Clarios screens are in English. This handbook comes in English and German, but the buttons and menu names are the same (English) in both.
Step by step: sign in
- Open Clarios in your browser. The live instance is at go.clarios.app, or use the address your IT team gave you.
- Click Sign in.
- Sign in with your usual Microsoft 365 account, the same one you use for Outlook or Teams. There is no separate Clarios password.
✅ Done. You’re in, looking at the Dashboard (your home page).
ℹ️ Two instances: go.clarios.app is the live, stable instance and the right one for everyday work. dev.clarios.app is a development instance that gets new features sooner but can be less stable. Use dev.clarios.app only if your IT team asks you to.
🖼️ Screenshot: The Clarios sign-in page showing the Clarios logo and the Sign in button, before the Microsoft sign-in appears. Light theme.
Target file:
assets/getting-started/sign-in.png
The very first time: someone has to approve access
Before Clarios can show you anything, it needs a one-time approval to read your data. A person with administrator rights, usually your IT team, gives this approval. Until then, the pages stay empty.
Here is how the approval is given: Approval & Settings. If your IT team has already done this, you can skip it.
Finding your way around
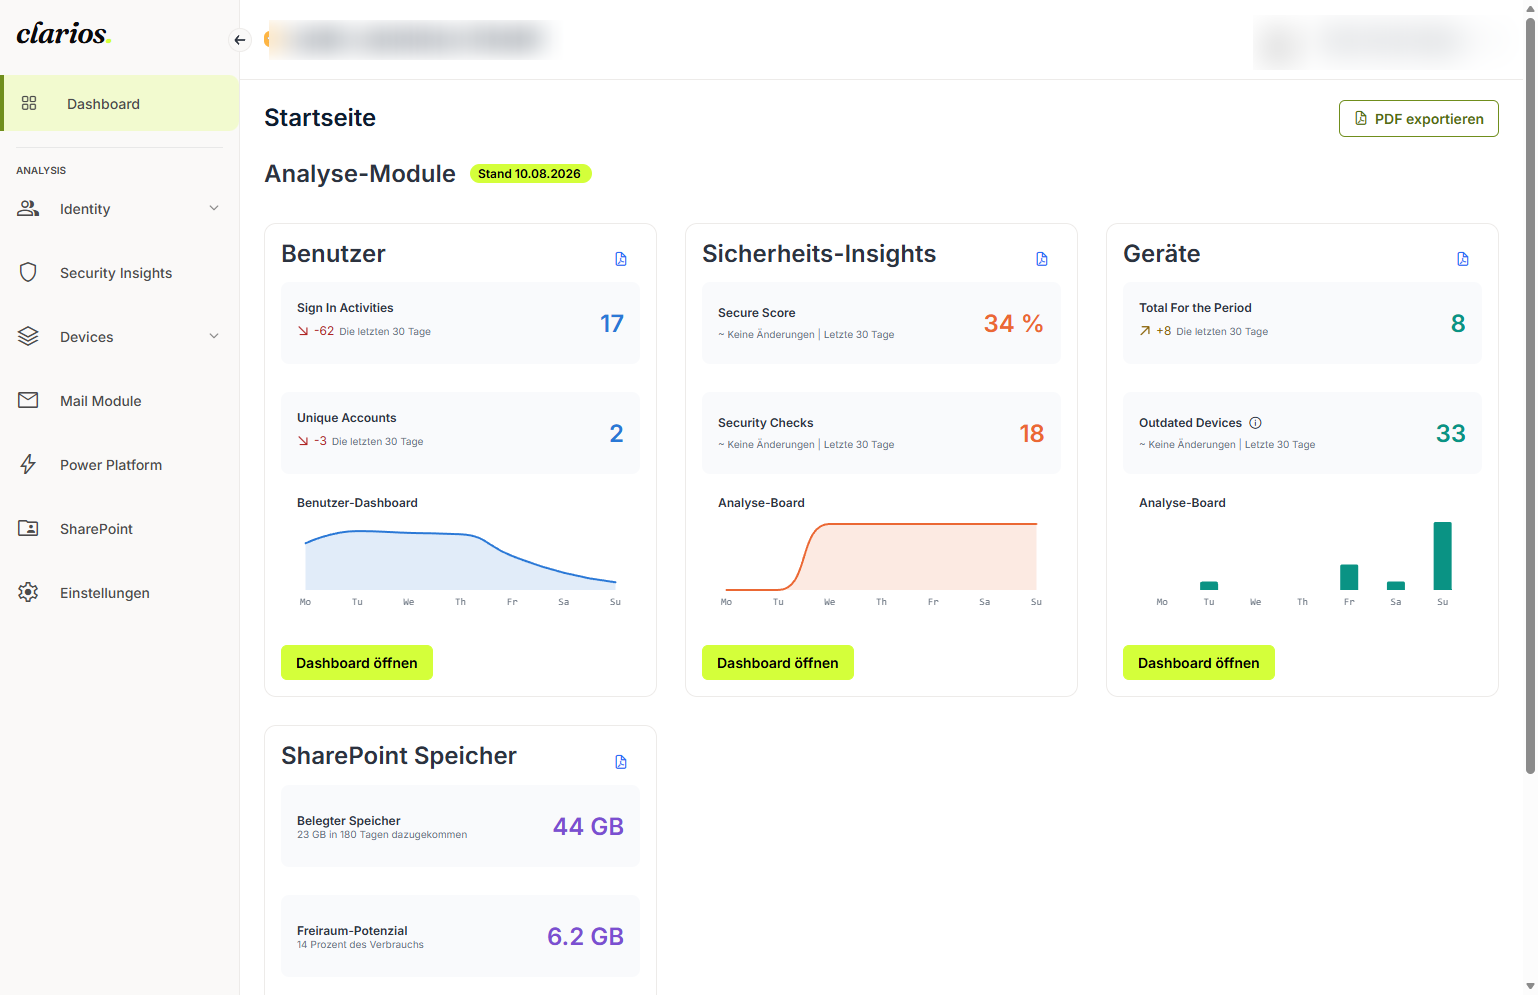
Your menu is on the left, top to bottom:
- Dashboard: your home page with one tile per area.
- The areas that are switched on for you:
- Devices: your devices
- Users: your people’s sign-ins
- Security insights: the security check
- Mail: protection for your email domains
- Settings (at the bottom): approvals and permissions.
ℹ️ A lock icon? An area with a lock isn’t switched on for you yet. Ask your IT team or your Clarios contact.
What can you do?
That depends on your permission level:
- Reader: view everything (dashboards, reports).
- Writer: also change things, for example fix a security issue.
- Admin: also manage.
More: Who can do what?
What’s next?
- 🛡️ Admins: start by giving approval.
- Everyone: open the Dashboard and dive into the area you care about most.