Your dashboard
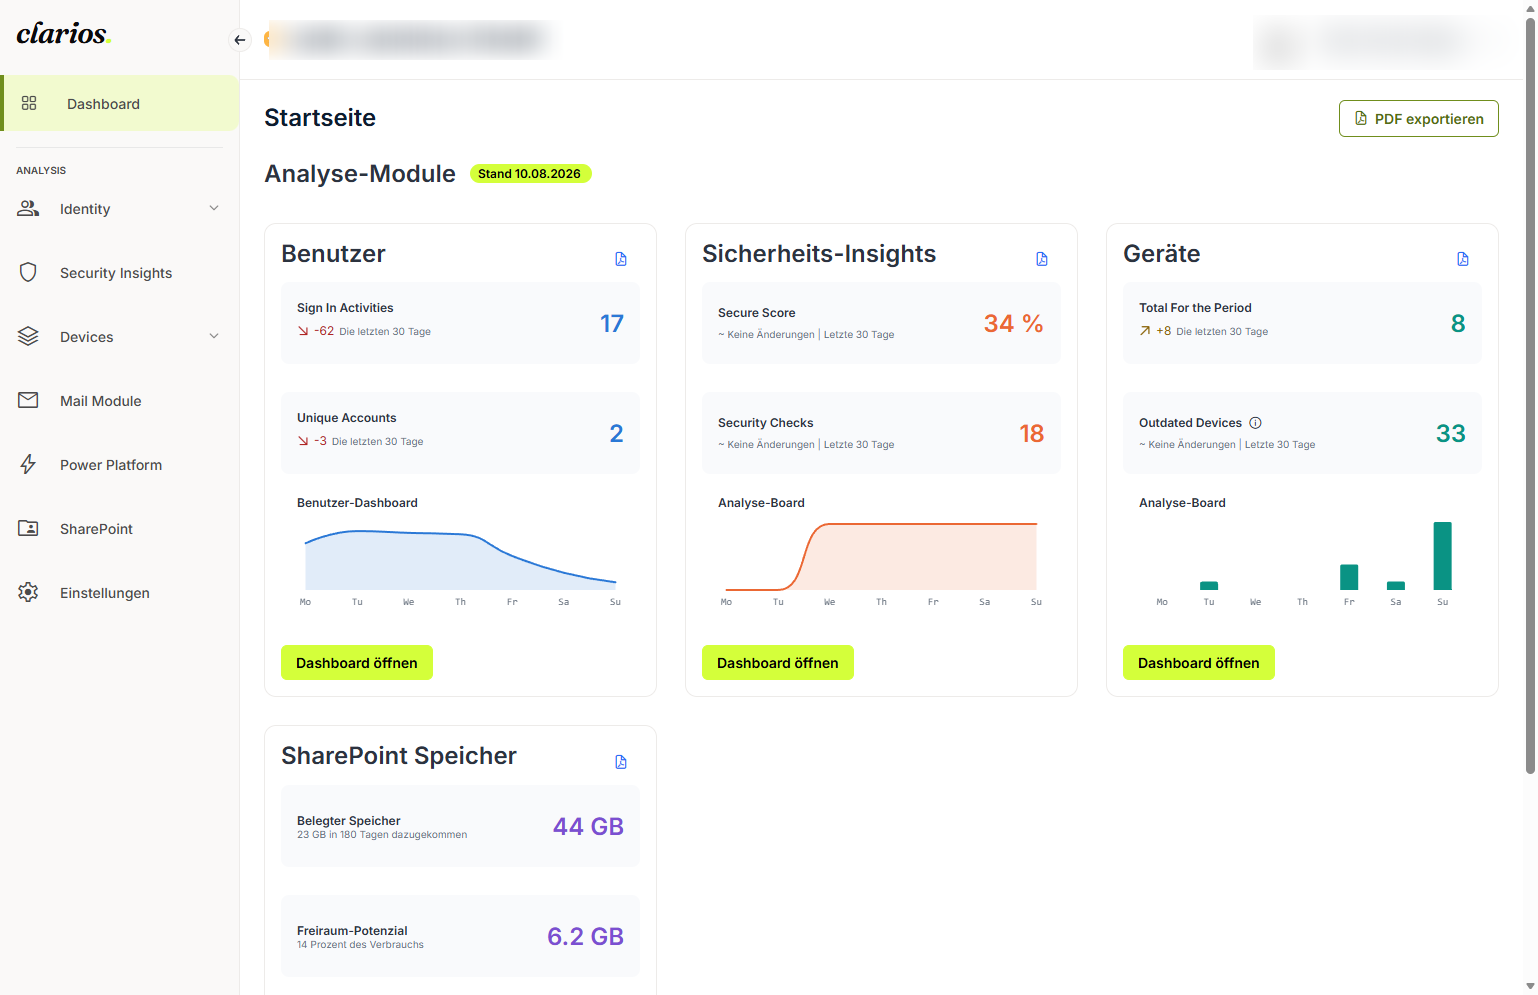
The dashboard is your home page after signing in. It shows one tile per switched-on area with the most important numbers. At a glance, you can see where you stand.
What you see here
- At the top, the title Home and, on the right, the Export PDF button.
- Below it, the Analysis Modules section with one tile each for Users, Security insights and Devices. Every tile shows two key figures, a small trend (an up/down arrow, otherwise No Changes or No Data) and a View Dashboard link to the full area.
- The numbers are as of yesterday (the date is shown next to the heading).
ℹ️ Note: Mail has its own dashboard with its own Export PDF. It isn’t a tile on this page.
What you can do here
- Create a PDF report: the whole dashboard or a single tile.
- Open an area in detail: click View Dashboard on a tile.
Good to know
- A tile with a lock, or blurred? That area isn’t switched on for you yet, and View Dashboard is greyed out. An administrator switches areas on in the Admin Panel.
- A “Complete your company profile” prompt? Click Fill in to add your company name (it also appears on your PDF reports), or × to dismiss it. More: Complete your company profile.